ONAs have more members, fewer closures than other UCC churches, study finds
Recent United Church of Christ studies show ONA congregations – those that are publicly open and affirming to LGBTQ people – are attracting, on average, more new members and are less likely to close than the UCC average.
“The results refute the ‘urban legend’ that UCC churches typically lose money and members when they vote to become ONA,” said Andy Lang, executive director of the UCC Open and Affirming Coalition.
The UCC Center for Analytics, Research and Data released the latest of two studies Nov. 14. Focusing on membership and church-closure statistics, it compared some 1,600 ONA congregations to those that have not declared themselves ONA. It found that, in 2018, ONA churches:
- Had, on average, 31 percent more members than non-ONA churches (Graph 1).
- Reported an average worship attendance that was almost 33 percent higher than that of non-ONA churches (Graph 2).
- Reported adding an average of 11.1 new members, compared to an average of 7.4 reported by non-ONA churches (Graph 3).
Graph 1: Average local church membership in 2018:

Graph 2: Average worship attendance, 2018:
 Graph 3: New members added in 2018:

It also found that, from 2014 to 2018, 1.8 percent of ONA churches closed or merged (Graph 3). That was lower than the overall UCC average (2.4 percent) and the average for non-ONA UCC congregations (3.2 percent).
Graph 3: Local churches that closed or merged, 2014 through 2018:

CARD did the research at the Coalition’s request, drawing statistics from UCC Yearbook and Directory reports filed by local churches. ONA congregations were identified using the Coalition’s database.
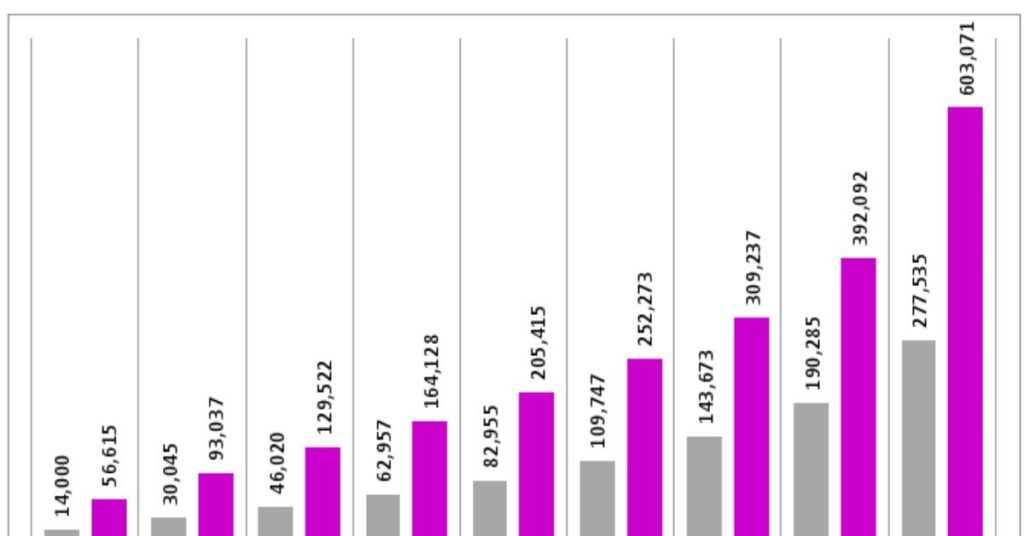
Earlier research, completed by CARD in May 2019 for another project, showed that ONA churches have substantially higher budgets than non-ONA churches (Graph 4). This was calculated considering operating expenses, capital payments, total giving to Our Church’s Wider Mission and other giving (beyond the UCC) – again, as reported by local churches for the Yearbook.
Graph 4: Average local church budgets in dollars. Purple = ONA; gray = non-ONA:
 Row of numbers at bottom groups churches by percentile: from the 10 percent of churches with the smallest budgets to the 10 percent with the highest.
Lang welcomed the results of both studies.”One of the reasons congregations hesitate to begin their ONA journey is fear: the fear of losing members and income if the church votes to adopt an ONA covenant,” he said. “But this latest research shows the opposite is happening.”
He urged common-sense caution in interpreting the results, noting that an ONA covenant does not guarantee a congregation will be financially healthier or attract new members.
“It all depends on how well a church integrates its ONA commitment into its vision, identity, communications and priorities,” Lang said. “We’ve learned that ONA churches that are visible and active in their communities have the potential to grow – in numbers and in spirit. Churches that are invisible and inactive may continue to stagnate. Moreover, a church’s ONA status is one of the most important reasons, but not the only reason, it can attract new members. And there are, of course, non-ONA churches that are healthy.”
Related News

Saving the Right to Vote
The United Church of Christ’s Our Faith, Our Vote Campaign continues for the 2026 elections....
Read More
New Our Faith Our Vote toolkit and resources launch ahead of historic November midterms
As the 2026 midterm elections approach in November, there are new resources to help faith...
Read More
Op-Ed: In a Sea of Silence
Lorenzo Salgado Araujo. Say his name. Before he became a headline, he was a husband, a...
Read More