A Fair Balance: Reducing Inequality in the United States and Around the World
Sekinah Hamlin, Minister for Economic Justice
Justice and Witness Ministries, United Church of Christ
In Paul’s second letter to the Corinthians, he asks them to donate money to poor Christians in Jerusalem. He writes, “I do not mean that there should be relief for others and pressure on you, but it is a question of a fair balance between your present abundance and their need, so that their abundance may be for your need, in order that there may be a fair balance. As it is written, ‘the one who had much did not have too much, and the one who had little did not have too little’” (2 Corinthians 8:13-15).
Paul instructs the Corinthians on the importance of a “fair balance,” where no one has either too much or too little. May we have ears to truly hear Paul’s message today at a time when, in the United States and around the world, there are a few, extremely wealthy people, far too many poor, and many in the middle who are struggling to avoid sliding into poverty. As Paul said, a fair balance is needed. One person’s abundance is for another person’s need. There is plenty for all if we share. The Church is called to work for a world where there is a “fair balance” between abundance for a few and the needs of many.
Inequality – U.S. and Global
In recent decades, income inequality has widened within most countries.[i] The poor have fallen deeper into poverty, the rich have gotten richer, and those in the middle have seen their incomes stagnate or decline. Between the mid-1980s and mid-2000’s, among the 73 nations for which data are available, 53 countries (home to over 80% of the world’s population) had a rise in inequality while only 9 countries (with 4% of the global population) had a decline.[ii]
Such an unequal sharing of resources has a direct impact on people’s lives including their health, access to education, and opportunities for advancement. In Bolivia and Peru, infant death rates are four to five times higher for the poorest 20% of the population compared with the richest 20%.[iii] A baby boy born in the U.S. to a family in the top 5% will live 25% longer than a boy born into the bottom 5%.[iv]
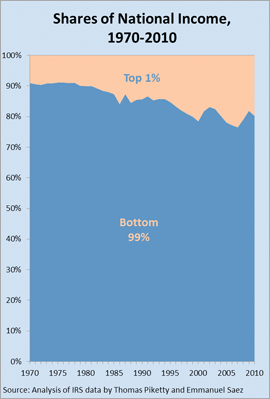
In the United States, the combined income of the top 1% of households[v] more than doubled between 1970 and 2010, rising from 9% of national income to 20%. (See the chart.) In 2007, before the onset of the economic crisis, their income reached 24%. (To be in the top 1% in 2010, a household needed income of over $352,000.) If the top 1% had received the same share of national income in 2010 as in 1970, then income for each household in the bottom 99% would have been over $5,600 larger.
As inequality has grown among people within most countries, it has also increased among countries. Rich countries have gotten richer and pulled further in front of poorer ones. For example, in 1990, average income in the United States was 38 times larger than in Tanzania. Fifteen years later, in 2005, income in the U.S. was 61 times larger.[vi] In rich countries, income per person, adjusted for inflation, has risen two- to three-fold since 1970, a much larger gain than in poorer ones. In 13 poor countries, average income today is lower than in 1970.[vii]
As the apostle Paul wrote, “It is a question of a fair balance between your present abundance and their need.” The world is richly endowed with God’s abundance. Surely God must be offended and saddened by such inequality.
Inequality Affects Us All
We know that poverty is destructive of people’s lives and blocks them from the fullness of life that God intends for all of us. The poor lack basic necessities like food, quality education and health care, adequate housing, and opportunities to improve their lives. But less well known is that inequality is destructive of people’s lives and its impact is felt at all income levels: the bottom, the middle, and the top. In a country with a high level of inequality, everyone does less well than if there were more equality.
To illustrate the impact of inequality, let’s consider its effect on health. We know that longevity and susceptibility to illness are influenced by numerous factors including diet, exercise, genetics, tobacco use, the physical environment, access to health care, and quality of health care. Researchers have found than someone’s income level also affects their health. On average, poor people have worse health and shorter lives than those with middle-incomes, and middle-income people do worse than the rich. While in an individual case a poor person could be healthier and live longer than a rich one, this is the exception, not the rule.
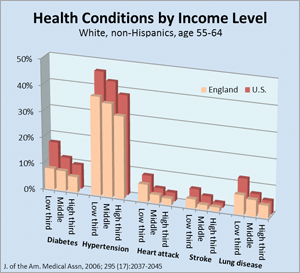
We know income impacts our health but so does inequality (and it also affects many other aspects of our lives). Consider the health of people in the U.S. and England. These two countries are fairly similar so we might expect similar health outcomes.[viii] But there is one important difference: inequality is much higher in the U.S. than in England.
The chart shows the prevalence of five illnesses in white, non-Hispanic, 54- to 66-year-olds categorized by their income level into three sections of the income scale: the lower third, middle third, and upper third.[ix] Researchers used statistical techniques to net out the effects of age, sex, education level, income, current or former use of tobacco, being overweight or obese, and heavy alcohol use. As we would expect, each of these five illnesses was more common among people in the lower third of the income scale than among the middle third, and the illnesses were more common among the middle third than the upper third. But the chart also shows the impact of inequality. Each illness is less common in England than the U.S. in all three income groups. The higher level of inequality in the U.S. makes each of these illnesses more common at every income level – high, middle, and low. A reduction in inequality would benefit everyone, from poor to rich.
Our physical health is not the only aspect of our lives affected by inequality. In more unequal societies, people – from rich to poor – have more mental illness, shorter life expectancies, and higher infant mortality compared with people in less unequal ones. They also have more addictions to illicit substances (although they are not more likely to use them) and incarcerate a larger share of the population.
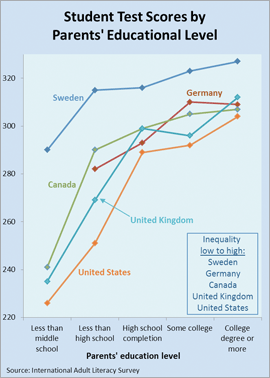
Moreover, in more unequal societies children – of all social classes – do less well in school than children in more equal ones. The chart below shows test scores for students, classified by their parent’s education level, in five countries with varying levels of inequality.[x] Sweden has the lowest inequality followed by Germany, Canada, the United Kingdom and, finally, the United States with the highest. In each country, test scores rise with increases in the level of parents’ education. But the scores for each country also track fairly well the level of inequality. Children in Sweden, the country with the lowest inequality, score highest, at each level of parents’ education. Children in the U.S., the country with the highest inequality, score lowest at every level of parents’ education. In between those two extremes, at each level of parental education, students’ scores fairly closely line up with a country’s level of inequality.
Inequality matters most for children whose parents have lower levels of education, that is, the cross-country differences in test scores are largest for children whose parents had the lowest education. But even among children whose parents had a college degree or more, inequality matters. Students from families with high levels of parental education performed less well in countries with high inequality compared with those with low.
Researchers have found that countries (or states within the U.S.) with higher levels of inequality have:
- a lower level of trust,
- less social cohesion,
- a greater focus on materialism,
- heightened competition for status,
- more stress, and
- less support for the common good.
These factors are believed to account for the adverse outcomes that affect everyone in the society, whether poor, middle income, or rich.[xi]
How to Reduce Inequality
A high degree of inequality is not inevitable. Although inequality has been getting worse in the U.S. and around the world, this trend can be reversed.
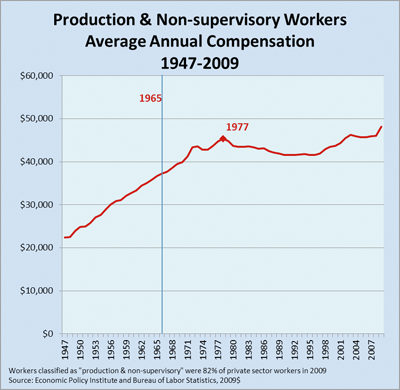
Wages and salaries. Many adults receive most or all of their income from a job. Since the late 1970s, the 82% of all private sector workers in jobs classified as “production, non-supervisory” have seen their average compensation (wages and salaries plus benefits) stagnate. (See the chart on the left, below.[xii]) At the same time, compensation of chief executive officers has skyrocketed. At the largest 350 corporations, CEO pay[xiii] rose more than 725% between 1978 and 2011.[xiv]
 |
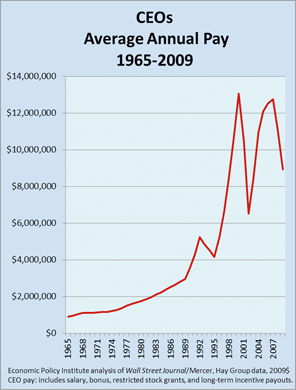 |
Note the different scales on these two charts. In the one on the left, compensation goes from $0 to $60,000; in the one on the right, goes from $0 to $14 million. The one on the left begins in 1947 and shows rising pay until 1977 then stagnation for the next 32 years. The chart on the right begins in 1965; data are lacking for the prior years.
To raise wages for the majority of workers we need strong labor unions; strengthened labor protections; more supports for workers such as childcare, universal early childhood education, and paid sick days; and an increase in the minimum wage. In addition, our international trade and investment agreements need to be rewritten to level the playing field between corporations and workers in both the U.S. and around the world. Tax laws also need reform to eliminate advantages given to firms that send jobs overseas.
Jobs.Unemployment exacerbates the inequalities created by the very unequal pay that workers receive. Lower-wage workers have higher rates of unemployment and are less likely than higher-wage ones to receive unemployment insurance benefits.[xv] Congress must make job creation, not deficit reduction, its priority, put millions of people back to work, and strengthen the unemployment insurance system.[xvi]
Health insurance. Lower-wage workers are less likely than higher-wage ones to have health insurance. People without insurance pay more for (or forego) health care. The lack of health insurance or inadequate coverage caused one in six people (17%) to face serious financial problems in 2011.[xvii] Benefits like health insurance which are common among higher-wage workers but very uncommon among lower-wage ones worsen inequalities due to earnings.
The Affordable Care Act, passed by Congress in 2011 and upheld by the Supreme Court in 2012, will extend health insurance coverage to an estimated 30 million people, reducing the number of uninsured by more than half. The Act also caps the amount that families with incomes below four-times the poverty level would spend out of pocket, protecting them from financial hardship.[xviii]
Pensions. Inequities in employer-sponsored pension plans also exacerbate inequality. Only about half of full-time workers have any type of employer-related retirement plan such as a traditional pension or a 401(k) plan. Among the one-fifth of workers with the highest pay, 64% have employer-sponsored retirement coverage but among the one-fifth of workers with the lowest pay, just 9% to 12% have coverage.[xix] Without pensions, these low-wage workers will likely be low-income retirees.
The most common form of employer-sponsored pension is a 401(k) type of plan. Currently, workers pay no federal income tax on their contributions to these plans, a tax break that costs the government over $100 billion per year. But because upper-income workers are more likely to have these plans, more likely to contribute to them, and typically contribute larger amounts, they also receive most of the tax breaks. Fully 80% of the $100 billion in tax breaks given for these retirement plans are claimed by the top 20% of earners.[xx] The tax treatment of these plans contributes to inequality.
The U.S. system of employer-sponsored pensions needs reform. The money now spent to encourage employee contributions that overwhelming aids higher-wage workers should instead be used to help lower-wage ones.[xxi]
Taxes. The wealthiest households should be paying more taxes. Between 1970 and 2010, when average income among the bottom 90% of households fell by 6%, the top 1/100th of 1% of households, some 16 thousand families, saw their incomes rise by 463% to over $23 million.[xxii] At the same time, the share of income they paid in federal taxes declined by 9.4 percentage points.[xxiii]
Taxes paid by corporations have also declined. Corporate income taxes totaled 4.0% of GDP in 1965 but fell to 2.5% of GDP in 2008 (and declined further during the financial crisis).[xxiv] In other major industrialized countries, corporate tax payments form a larger share of national income, averaging 3.0% of GDP. In 2008, the Government Accountability Office found that two out of every three U.S. corporations paid no federal income taxes between 1998 and 2005.[xxv] Corporate tax loopholes and subsidies cost hundreds of billions of dollars each year, encourage the export of jobs, and slow economic growth.
Declines in income taxes paid by wealthy households and corporations, as well as cuts in the estate tax that is paid entirely by the wealthy, reduce tax revenues and lead to cuts in government services and higher deficits. An increase in tax revenue could make higher education more affordable; improve the quality of public schools; provide universal health insurance and early childhood education; support infrastructure investments that create jobs, boost productivity, and enhance the quality of life; strengthen the safety net; and clean up the environment.
Global inequality
People of faith have long advocated for many reforms that would reduce global inequality: cancellation of the debts owed by impoverished countries, making trade agreements fairer to workers and businesses in the global South, and providing assistance for development and economic growth that will directly benefit the poor. But it is also critically important for us to realize that the usual method of fighting poverty – promoting economic growth – is fairly ineffective in a world where a high level of inequality is the norm.
In poor nations, poverty is typically due to scarcity – too little food; not enough money to dig wells in all villages; too few schools, teachers, hospitals, and health care workers – so some people go without. Thus, for centuries, the standard solution to poverty has been economic growth: enlarge the economic pie, produce more things and more income, and then there will be enough for all. In this view, the end of scarcity – being able to produce enough for all – also means the end of poverty.
But at this time in history, does economic growth reduce poverty? Is poverty really due to scarcity? Do increases in national income and the amount of goods and services produced in a country preferentially benefit the poor? In both the global North and South, the answer to all these questions is, unfortunately, no.[xxvi] In nations with high levels of inequality, which today includes most countries around the globe, most (or even all) of the gains from economic growth flow to those at the top of the income ladder, not the ones at the bottom or even in the middle. In the presence of high inequality, economic growth primarily produces more income and things for the already wealthy. The only exception to this typical pattern in where countries make a concerted effort to devote national resources to education, health care, and other measures to improve the lives of the poor.
This is true in rich countries and poor ones where there are high levels of inequality. Consider again what happened in the U.S. between 1970 and 2010. In 1970, average income among the bottom 90% of households was $31,839. Forty years later, in 2010, the economy had doubled in size, per person, but average income for the bottom 90% had fallen to $29,840, adjusted for inflation.[xxvii] Over the same 40 years, average income among the top 1/100th of 1% rose more than five-fold, up nearly $20 million per household. In the presence of inequality, just letting the free market work, even though it may grow the economy, is not an effective way to address poverty or even, as we have seen in the United States, to strengthen the middle class.
Economic Growth will not end Poverty
Policies to reduce inequality
Policies to promote a sharing of resources
|
Historically and still today, the primary goal of economic policy has always been to grow the economy. Producing more things and raising national income are the aims of most economists and policymakers in both the global South and North. But as we have seen, high levels of inequality mean economic growth provides little benefit to the poor or even the middle class. But at the same time, more growth means more energy use, more greenhouse gas emissions, more use of raw materials that are becoming scarce, more destruction of the environment, and more waste to dispose of. Our current use of resources is unsustainable. It takes 1½ years for the earth to regenerate the renewable resources that we are using in just one year or, in other words, to sustain our current level of global resource use requires 1½ planets.[xxviii] If everyone in the world today used resources at the rate of a typical U.S.-American, we would need four planets. Clearly we need to re-think our strategy for ending poverty and creating economic security for everyone. A sole focus on market-driven economic growth fails on two counts: it primarily benefits the wealthy, and it is unsustainable and environmentally destructive. In the global South, policies are needed to shape economic growth to benefit the poor. In the global North, growth is unnecessary but we must share our resources more equitably. What we sorely need, as Paul wrote, is a fair balance.
For the past 30 years, most countries worldwide have sought economic growth using policies designed to strengthen the “free market” (they are called “neoliberal” policies). These policies, enacted by national and state policymakers in the global North and South,[xxix] are the most important drivers of the growth in inequality and are destructive of the environment. They include reducing the role of government in the economy, deregulation, privatization, and “free trade” and “free investment” treaties. These policies must be reversed and replaced by others designed to reduce inequality and promote fullness of life for all people. Furthermore, if growth will not eradicate poverty, the only other option is a fairer sharing of resources between those with abundance and those in need. See the Box just above for a list of policies.
God created a world of abundance. If we share, there is enough for all to live in the fullness of life. Like the Corinthians we are called to follow Paul’s instructions, to find a fair balance between one person’s abundance and another’s need. The economy is not like the weather. It is created by people and can, and should be, directed by people to serve all people and the earth. Our goal is nothing less than a world where “the one who had much did not have too much, and the one who had little did not have too little.”
Endnotes
United Nations Development Program, Human Development Report 2011, New York: UNDP, 2010
[viii] Health insurance also plays a role in outcomes. While England has universal coverage, among the people in the U.S. who were examined in this study, 6.6% lacked insurance overall: 13.1% in the lowest income group, 4.1% in the middle income group, and 2.6% in the highest income group. The difference in insurance coverage may be part of the reason for the worse health outcomes for people in the lowest income third, but the differences in insurance coverage are too small to explain the differences in outcomes for the middle and upper thirds. See Banks, James, Michael Marmot, Zoe Oldfield, James P. Smith., “Disease and disadvantage in the United States and England,” Journal of the American Medical Association, 295(17)2037-2046, 2006. Another difference between the two countries is the amount spent on health care. The United Kingdom spends much less than the U.S. — just over half as much (56%) measured as a share of national income. This would be expected to worsen health outcomes in England compared with the higher-spending U.S. OECD, OECD Health Data 2011. http://www.oecd.org/document/60/0,3746,en_2649_33929_2085200_1_1_1_1,00.html Accessed June 12, 2012
[ix] Banks, James, Michael Marmot, Zoe Oldfield, James P. Smith. “Disease and disadvantage in the United States and England,” Journal of the American Medical Association, 295(17)2037-2046, 2006.
[x] Education Testing Service http://litdata.ets.org/ialdata/search.asp Accessed June 5, 2012
[xi] To read more about the effects of inequality, see The Spirit Level: Why greater equality makes societies stronger by Richard Wilkinson and Kate Pickett, Bloomsbury Press, 2009.
[xii] Economic Policy Institute http://stateofworkingamerica.org/charts/hourly-wage-and-compensation-growth-for-productionnon-supervisory-workers-and-productivity-1947-2009/
[xiii] CEO pay is total direct compensation: the sum of salary, bonus, restricted stock grants, and long-term incentive payouts. See Economic Policy Institute http://www.epi.org/publication/wp293-ceo-to-worker-pay-methodology/
[xiv] Lawrence Mishel, “CEO pay 231 times greater than the average worker,” Economic Policy Institute, May 3, 2012. http://www.epi.org/publication/ceo-pay-231-times-greater-average-worker/ Accessed June 25, 202.
[xv] Fagnoni, Cynthia M., “Unemployment Insurance: Receipt of Benefits Has Declined, with Continued Disparities for Low-Wage and Part-Time Workers,” Testimony Before the Subcommittee on Income Security and Family Support, Committee on Ways and Means, House of Representatives, General Accountability Office (GAO-07-1243T), September 19, 2007. http://www.gao.gov/new.items/d071243t.pdf Accessed June 27, 2012.
[xvi] See Edith Rasell, Unemployment is our Nation’s Problem, not the Deficit, UCC Justice and Witness Ministries, June 2011. http://www.ucc.org/justice/financial-crisis/U_not_deficit.html
[xvii] Kaiser Family Foundation, “Health care costs: key information on health care costs and their impact,” May 2012, p. 17. http://www.kff.org/insurance/upload/7670-03.pdf Accessed June 25, 2012.
[xviii] For more information, see Families USA, “Worry Less, Spend Less: Out-of-Pocket Spending Caps Protect America’s Families,” February 2011. http://www.familiesusa2.org/assets/pdfs/health-reform/out-of-pocket-spending-caps/National-Report.pdf Accessed July 2, 2012
[xix] Workers age 25-64. Munnell, Alicia H. and Laura Quinby, “Pension coverage and retirement,” Center for Retirement Research, Boston College, December 2009, p. 3. http://crr.bc.edu/wp-content/uploads/2009/12/IB_9-26.pdf
[xx] Ghilarducci, Teresa, “The Solution to the Pension crisis is more pensions,” Perspectives on Work, Summer 2010/Winter 2011, p. 36. http://lera.press.illinois.edu/POW_14.1-2.pdf Accessed June 27, 2012.
[xxi] For more information see Teresa Ghilarducci, “Guaranteed Retirement Accounts: Toward retirement income security,” Economic Policy Institute, November 20, 2007. http://www.sharedprosperity.org/bp204/bp204.pdf
[xxii] Emmanuel Saez and Thomas Piketty, Table A6, http://emlab.berkeley.edu/users/saez/piketty-saezOUP04US.pdf
[xxiii] Data from Saez and Piketty. Effective tax rates from Josh Blevins, “Taxes have fallen furthest for those at the very top,” Economic Policy Institute, May 10, 2012 http://www.epi.org/publication/taxes-fallen-furthest-top/ Accessed June 26, 2012.
[xxiv] Tax Policy Center, “Corporate Income Tax as a Share of GDP, 1946-2009.” http://www.taxpolicycenter.org/taxfacts/displayafact.cfm?Docid=263&Topic2id=70 Accessed May 4, 2011
[xxv] Browning, Lynnley, “Study Tallies Corporations Not Paying Income Tax,” New York Times, August 12, 2008 http://www.nytimes.com/2008/08/13/business/13tax.html?ref=opinion
[xxvi] See United National Development Program, Human Development Report 2010, New York: UNDP, 2010, pages 46-64.
[xxvii] All figures adjusted for inflation. Doubling of per capita GDP. In 2007, just before the economic recession, average income among the bottom 90% of households exceeded the 1973 level, by $300, for the first and only time. Average income declined in 2008 and has fallen further in each subsequent year. Thomas Piketty and Emmanuel Saez, Table A6. http://emlab.berkeley.edu/users/saez/piketty-saezOUP04US.pdf.
[xxviii] World Wildlife Federation International. 2012 Living Planet Report. http://www.worldwildlife.org/science/LivingPlanetReport/index.html Accessed August 2, 2012.
[xxix] In the global South, neoliberal policies have often been imposed. See Naomi Klein, The Shock Doctrine, Picador, 2008.